Merchant Dashboard - Breakdown and Overview
As a coffee shop owner we understand how critical business insight is and how necessary it is for your daily operations. Our goal is to build technology and tools that empower the indie coffee community and grow your coffee shop, so below is a full walk through of our Merchant Portal Dashboard. Feel free to email us at success@joe.coffee with any additional questions or reports needed for your reporting needs.
IN THIS ARTICLE
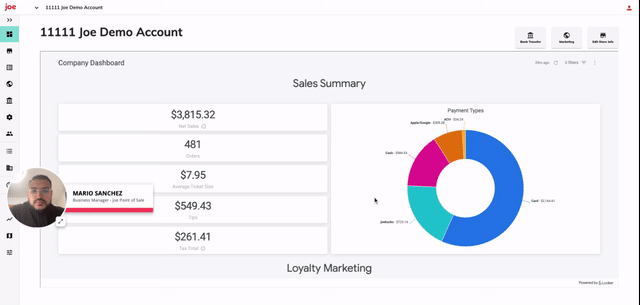
How to leverage your Sales Summary
Please note: When you open your dashboard it will automatically default to your daily view for your company view. If you have more than one store location you can select the store name filter and select the specific store you'd like to view for a daily, weekly, monthly or customer date range.

| Name |
|
Description |
| Net Sales |
|
Items - discounts |
Orders
|
Total Orders based on selected date filter
|
|
| Average Ticket Sales | Net Sales divided by Total Orders for the selected date equals Avg Ticket | |
Tips
|
Tips paid by customer
|
|
| Tax Total | Tax applied to goods and fees paid by customer | |
| Payment Type | ||
| Card |
|
Transactions paid by credit/debit card through mobile & in person order |
| joe Bucks | Payment done with joe balance through Mobile App | |
| Gift Cards | Purchases made by customers with store gift card balance | |
| Bank | Payment completed by customers who have linked their bank accounts | |
| Apple/Google Pay | Payment completed by customers who have linked their apple/google pay for in person & mobile orders | |
| Cash | Cash Transactions for in person orders |
How does joe Loyalty Marketing Dashboard impact your bottom line?

| Name | Description | |
| Loyalty Marketing Attributed Revenue | |
Total new revenue driven by joe’s automated marketing programs and new customer acquisition. |
| Loyalty Attributed Revenue | |
Total new revenue driven by joe’s automated marketing programs among customers you activated. |
| Marketplace Attributed Revenue | |
Total new revenue driven by new customers that discovered you through joe’s marketplace. |
| Total Gift Card Balance | Net Sales from Gift Cards | |
| Total Gift Card Net Sales | Total Gift Card Balance held by customers | |
| Total Active Customers | |
Marketplace users are customers that discovered you through the joe app. Loyal customers are users that made their first joe purchase at your shop. New users have made their first order on the joe app at your store. |
| Marketplace Customers | |
Marketplace users are customers that discovered you through the joe app. |
| New Users | |
Loyal customers are users that made their first joe purchase at your shop. |
| Loyal Customers | |
New users have made their first order on the joe app at your store. |
How do you leverage your Transaction Trends for Business Operations?


| Name | Description | |
| % Skipped Line | |
Percentage of customers that indicated they were able to skip the line. For the best experience, target 95%. |
| % Ready when arrived | Percentage of customers that indicated their order was ready when they arrived. For the best experience, target 95%. |
|
| Average Customer Rating | Average rating on a scale of 1-5 that your customers have rated their experience. The network average is 4.8. This is not public information and is ony visible for partners and internal use only. |
|
| AVG Minutes to Order Completed | |
This is how long it takes for baristas to mark an order ready after making it. Target 5-7 minutes for the best experience. |
| Trailing Weekly Orders | |
Week begins on Monday. First and last weeks may be partial. |
| Trailing Daily Orders | Daily Orders based on date selection from filter. Default is day of | |
| Orders By Hour | Orders by hours based on store operating hours | |
| Sales By Hour | Total sales by hour based on store operating hours. The darker colors indicates higher sales | |
| Top Order Items | Top 10 Ordered Items from the daily, weekly or customer date range selected. |
How do I leverage my Earning and Deposits Views?
- Transfer Amounts = - joe Commission + Reimbursements - Total Collected
- Total Collected = Tips + Sales Tax + Service Charge Tax + Net Sales
- Net Sales = Gross Sales - Discounts
- Gross Sales = Net Sales + Discounts


| Name | Description | |
| Gross Sales | |
Item Base Price + Discounts |
| - Discounts | Discounts include any promos or rewards applied to an order paid by shop | |
| = Net Sales | |
Gross Sales - Discounts |
| + Service Charge Tax |
Tax on fees paid by consumers | |
| + Sales Tax | Tax the customer paid on order - to be remitted by shop | |
| + Tips | Tips paid by customers (Card/Mobile Orders only) | |
| = Total Collected | Net Sales + Tips + Sales Tax + Service Charge Tax | |
| - joe Commission | In person orders of 2.6% + .10 rate for joe Point of Sale. 9% is our standard mobile marketplace and online ordering fee (drops to 7% with link placement on website, Instagram, and Google Biz Profile) or discounted rates upon registration. |
|
| + Reimbursements | Promotion and marketing campaigns paid for by joe to be reimbursed to partners | |
| = Transfer Amount | Amount Transferred to your for the date period selected | |
Fees paid by Consumers |
For customers that do not preload, we pay significantly more in processing fees. In order to keep commission as low as possible for our partners we rely on people preloading to avoid the fee or paying the convenience fee so that we can squeeze out a profit and continue to improve our technology to better serve our partners and customers |
|
How do I reconcile my transfer amounts using the transfer summary view?

| Name | Column | Description |
| Store Name | A | Store Name selected on the filter based on filter |
| Order Date | B | The date or date range associated of the orders in this specific transfer amount |
| Transfer Date | C | Date that Stripe transferred funds to your bank. *Note that banks have different turnaround times on deposits. |
| Batch ID | D | Are the confirmed (completed) orders we group together to properly begin processing. The BATCH ID is all the confirmations that get sent together based on date. |
| Total Collected |
E | All credit, debit, apple, google and or ACH payments processed through stripe. Excluding all cash sales for Point of Sale Partners. For payment type breakdown for specific date please utilize your Operations Overview |
| joe Commission | F | In person orders of 2.6% + .10 rate for joe Point of Sale. 9% is our standard mobile marketplace and online ordering fee (drops to 7% with link placement on website, Instagram, and Google Biz Profile) or discounted rates upon registration. |
| Reimbursement | G | Promotion and marketing campaigns paid for by joe to be reimbursed to partner |
| Transfer Amount | H | Amount transferred to the store's bank account post cost. Non-Cash sales - Consumer fee - Commission + reimbursements = Transfer Amount. |